|
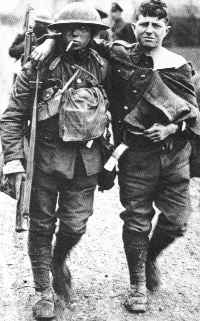
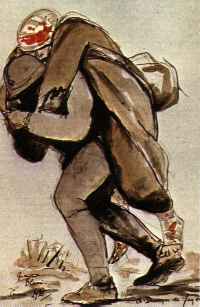
Assisting a wounded mate.
Sorted by number Mobilized
                       Mobilized            Dead         Wounded     Missing/PoW
Russia                12,000,000       1,700,000       4,950,000       2,500,000
Germany               11,000,000       1,773,700       4,216,058       1,152,800
Great Britain          8,904,467         908,371       2,090,212         191,652
France                 8,410,000       1,375,800       4,266,000         537,000
Austria-Hungary        7,800,000       1,200,000       3,620,000       2,200,000
Italy                  5,615,000         650,000         947,000         600,000
US                     4,355,000         126,000         234,300           4,526
Turkey                 2,850,000         325,000         400,000         250,000
Bulgaria               1,200,000          87,500         152,390          27,029
Japan                    800,000             300             907               3
Rumania                  750,000         335,706         120,000          80,000
Serbia                   707,343          45,000         133,148         152,958
Belgium                  267,000          13,716          44,686          34,659
Greece                   230,000           5,000          21,000           1,000
Portugal                 100,000           7,222          13,751          12,318
Montenegro                50,000           3,000          10,000           7,000
 Click here for graph of table Click here for graph of table
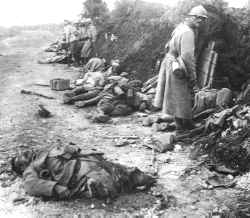
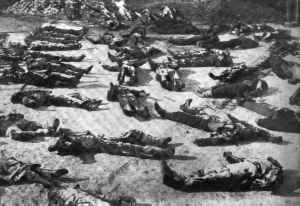
Artillery aftermath.
Sorted by number dead
                       Mobilized            Dead         Wounded     Missing/PoW
Germany               11,000,000       1,773,700       4,216,058       1,152,800
Russia                12,000,000       1,700,000       4,950,000       2,500,000
France                 8,410,000       1,375,800       4,266,000         537,000
Austria-Hungary        7,800,000       1,200,000       3,620,000       2,200,000
Great Britain          8,904,467         908,371       2,090,212         191,652
Italy                  5,615,000         650,000         947,000         600,000
Rumania                  750,000         335,706         120,000          80,000
Turkey                 2,850,000         325,000         400,000         250,000
US                     4,355,000         126,000         234,300           4,526
Bulgaria               1,200,000          87,500         152,390          27,029
Serbia                   707,343          45,000         133,148         152,958
Belgium                  267,000          13,716          44,686          34,659
Portugal                 100,000           7,222          13,751          12,318
Greece                   230,000           5,000          21,000           1,000
Montenegro                50,000           3,000          10,000           7,000
Japan                    800,000             300             907               3
Click here for graph of table
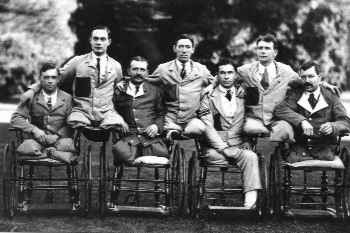
A few of the 240,000 British war amputees.
Sorted by number wounded
                       Mobilized            Dead         Wounded     Missing/PoW
Russia                12,000,000       1,700,000       4,950,000       2,500,000
France                 8,410,000       1,375,800       4,266,000         537,000
Germany               11,000,000       1,773,700       4,216,058       1,152,800
Austria-Hungary        7,800,000       1,200,000       3,620,000       2,200,000
Great Britain          8,904,467         908,371       2,090,212         191,652
Italy                  5,615,000         650,000         947,000         600,000
Turkey                 2,850,000         325,000         400,000         250,000
US                     4,355,000         126,000         234,300           4,526
Bulgaria               1,200,000          87,500         152,390          27,029
Serbia                   707,343          45,000         133,148         152,958
Rumania                  750,000         335,706         120,000          80,000
Belgium                  267,000          13,716          44,686          34,659
Greece                   230,000           5,000          21,000           1,000
Portugal                 100,000           7,222          13,751          12,318
Montenegro                50,000           3,000          10,000           7,000
Japan                    800,000             300             907               3
Click here for graph of table
Seriously wounded man: Somme, 1916
by Andre Dunoyer de Segonzac
Sorted by number missing/PoW
                       Mobilized            Dead         Wounded     Missing/PoW
Russia                12,000,000       1,700,000       4,950,000       2,500,000
Austria-Hungary        7,800,000       1,200,000       3,620,000       2,200,000
Germany               11,000,000       1,773,700       4,216,058       1,152,800
Italy                  5,615,000         650,000         947,000         600,000
France                 8,410,000       1,375,800       4,266,000         537,000
Turkey                 2,850,000         325,000         400,000         250,000
Great Britain          8,904,467         908,371       2,090,212         191,652
Serbia                   707,343          45,000         133,148         152,958
Rumania                  750,000         335,706         120,000          80,000
Belgium                  267,000          13,716          44,686          34,659
Bulgaria               1,200,000          87,500         152,390          27,029
Portugal                 100,000           7,222          13,751          12,318
Montenegro                50,000           3,000          10,000           7,000
US                     4,355,000         126,000         234,300           4,526
Greece                   230,000           5,000          21,000           1,000
Japan                    800,000             300             907               3
Click here for graph of table
Polish dead in Latvia.
Sorted by percent dead of total Mobilized
                          Dead %       Wounded %   Missing/PoW %
Rumania                   44.76%          16.00%          10.67%
France                    16.36%          50.73%           6.39%
Germany                   16.12%          38.33%          10.48%
Austria-Hungary           15.38%          46.41%          28.21%
Russia                    14.17%          41.25%          20.83%
Italy                     11.58%          16.87%          10.69%
Turkey                    11.40%          14.04%           8.77%
Great Britain             10.20%          23.47%           2.15%
Bulgaria                   7.29%          12.70%           2.25%
Portugal                   7.22%          13.75%          12.32%
Serbia                     6.36%          18.82%          21.62%
Montenegro                 6.00%          20.00%          14.00%
Belgium                    5.14%          16.74%          12.98%
US                         2.89%           5.38%           0.10%
Greece                     2.17%           9.13%           0.43%
Japan                      0.04%           0.11%           0.00%
Click here for graph of table
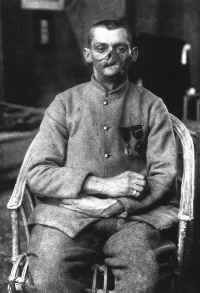
One of the "men with broken faces."
Sorted by percent wounded of total Mobilized
                          Dead %       Wounded %   Missing/PoW %
France                    16.36%          50.73%           6.39%
Austria-Hungary           15.38%          46.41%          28.21%
Russia                    14.17%          41.25%          20.83%
Germany                   16.12%          38.33%          10.48%
Great Britain             10.20%          23.47%           2.15%
Montenegro                 6.00%          20.00%          14.00%
Serbia                     6.36%          18.82%          21.62%
Italy                     11.58%          16.87%          10.69%
Belgium                    5.14%          16.74%          12.98%
Rumania                   44.76%          16.00%          10.67%
Turkey                    11.40%          14.04%           8.77%
Portugal                   7.22%          13.75%          12.32%
Bulgaria                   7.29%          12.70%           2.25%
Greece                     2.17%           9.13%           0.43%
US                         2.89%           5.38%           0.10%
Japan                      0.04%           0.11%           0.00%
Click here for graph of table
Sorted by percent missing/PoW of total Mobilized
                          Dead %       Wounded %   Missing/PoW %
Austria-Hungary           15.38%          46.41%          28.21%
Serbia                     6.36%          18.82%          21.62%
Russia                    14.17%          41.25%          20.83%
Montenegro                 6.00%          20.00%          14.00%
Belgium                    5.14%          16.74%          12.98%
Portugal                   7.22%          13.75%          12.32%
Italy                     11.58%          16.87%          10.69%
Rumania                   44.76%          16.00%          10.67%
Germany                   16.12%          38.33%          10.48%
Turkey                    11.40%          14.04%           8.77%
France                    16.36%          50.73%           6.39%
Bulgaria                   7.29%          12.70%           2.25%
Great Britain             10.20%          23.47%           2.15%
Greece                     2.17%           9.13%           0.43%
US                         2.89%           5.38%           0.10%
Japan                      0.04%           0.11%           0.00%
Click here for graph of table
These figures from The Two World Wars, Vol I - World War I by Susan Everett
Published 1980 by Bison Books

Notes:
Russia.wounded   - Includes 1,450,000 permanently disabled
France.wounded   - Includes 690,000 permanently disabled
Rumania.dead     - Excludes 265,000 civilians dead and missing
Portugal.wounded - Western front only. Another 6,000 dead in Africa
Turkey.wounded   - 1,565,000 including invalids and deserters
Bulgaria.wounded - Excluding those that died of disease during autumn 1918 retreat
|